Spectrograph simulation
- class qmostetc.Spectrograph(wavelength, widths, efficiency, fwhm=None, dark_flux=<Quantity 0. electron / s>, readout_noise=<Quantity 0. electron>, gain=<Quantity 1. electron / adu>, saturation=<Quantity inf adu>)
Spectrograph properties
The spectrograph is used to convert the fiber photon flux into an electron flux on the CCD bins. It also holds the dark current, readout noise and the ADC gain to calculate the response on an exposure. The main function here is
rebin(), which does all the necessary steps.The most convenient way to create a 4MOST standard spectrograph is the function
Spectrograph.qmost.- Parameters:
- wavelength
astropy.units.Quantity Left borders of wavelenght bins [nm]
- widths
astropy.units.Quantity Bin widths for each wavelength bin [nm]
- efficiency
astropy.units.Quantity Spectrograph specific efficiency for each wavelength bin [electron/photon]
- fwhm
astropy.units.Quantity Resolution (FWHM) for each wavelength bin [nm] (optional)
- dark_current
astropy.units.Quantity Dark current [electron/s] (optional)
- readout_noise
astropy.units.Quantity Readout noise [electron] (optional)
- gain
astropy.units.Quantity ADC gain [electron/adu] (optional)
- saturation
astropy.units.Quantity Saturation value [adu] (optional)
- wavelength
Examples
This example uses the green arm of the LRS to rebin a single line at 600 nm:
>>> import numpy as np
>>> import astropy.units as u
>>> from qmostetc import Spectrograph, Spectrum
>>> spec = Spectrograph.qmost('lrs', 'green')
>>> wl = np.arange(590., 610., 0.01) * u.nm
>>> line = np.zeros(wl.shape) * u.ph / (u.nm * u.s)
>>> line[1000] = 1e3 * u.ph / (u.nm * u.s)
>>> for i in range(1000-2,1000+3):
...     print(f'{wl[i]:.2f}: {line[i]:.2g}')
599.98 nm: 0 ph / (nm s)
599.99 nm: 0 ph / (nm s)
600.00 nm: 1e+03 ph / (nm s)
600.01 nm: 0 ph / (nm s)
600.02 nm: 0 ph / (nm s)
>>> flux = spec.rebin(Spectrum(wl, line))
>>> mx = np.argmax(flux.flux)
>>> for i in range(mx-3,mx+4):
...     print(f'{flux.wavelength[i]:.2f}: {flux.flux[i]:.2g}')
599.88 nm: 0.03 electron / s
599.92 nm: 0.23 electron / s
599.95 nm: 0.78 electron / s
599.98 nm: 1.2 electron / s
600.02 nm: 0.78 electron / s
600.05 nm: 0.23 electron / s
600.08 nm: 0.03 electron / s
>>> print(f'Total flux: {flux.flux.sum():.1f}')
Total flux: 3.2 electron / s
>>> print('Wavelength average: '
...      + f'{np.average(flux.wavelength, weights=flux.flux):.2f}')
Wavelength average: 599.98 nm
- as_filter()
Return the efficiency of the spectrograph as a filter
This is used as filter to calculate the arm magnitudes
- Returns:
SpectrumThe efficiency of the spectrograph
Examples
Show the magnitude of a spectrum in the LRS/blue arm:
>>> import astropy.units as u
>>> from qmostetc import Spectrograph, SEDTemplate
>>> spec = SEDTemplate('Pickles_G0V')(15*u.ABmag, 'GAIA_GAIA2r.G')
>>> lrs_green = Spectrograph.qmost('lrs', 'green')
>>> spec.get_mag(u.ABmag, lrs_green.as_filter())
<Magnitude 14.89... mag(AB)>
- limit_wavelength(wl_range)
Create a new Spectrograph with a limited wavelength
- Parameters:
- wl_range
astropy.units.Quantity Pair with (lower, upper) limits of the wavelength [nm]
- wl_range
- Returns:
SpectrographA new spectrograph with the limited wavelengths. If the paramter was None, the original
Spectrographobject is returned.
- rebin(spectrum)
Rebin a given spectrum
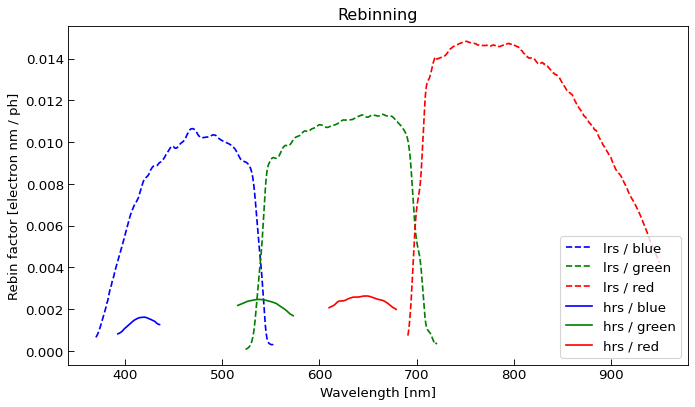
This takes a flux spectrum (per nm) at the fiber input (i.e. with atmospheric transmission, telescope area and efficiency, fiber area and fiber coupling applied) and calculates the measured flux spectrum (per bin) at the CCD.
The following effects are applied here:
Rebinning to the final spectral bins, and applying the bin width
Spectral resolution (optional)
Spectrograph througput and the CCD quantum efficiency
The exposure time is not applied here.
The following plot shows how the rebinning is applied on the 4MOST spectrograph arms:
- Parameters:
- spectrum
Spectrum Input spectrum [ph / (nm s)]
- spectrum
- Returns:
astropy.units.QuantityMeasured flux per bin on CCD [electron/s]
- static qmost(spectrograph, arm, spectral_binning=1, fname=None)
Standard 4MOST spectrograph
The spectrograph data are taken from a FITS provided by TOAD. If no file name is give, the data file provided with this package is used.
- Parameters:
- spectrograph
str Spectrograph name. Either “lrs” or “hrs”.
- arm
str Spectrograph arm name. One of “blue”, “green”, “red”.
- spectral_binning
int Spectral binning for CCD readout. The spacial binning during readout is fixed to 1, the number of spacial pixels during spectrum extraction is fixed to 5.
- fname
pathlib.Pathorstr TOAD file name. Defaults to the file provided with TOAD.
- spectrograph
- Returns:
SpectrographStandard spectrograph with the data of the given data file
Default 4MOST spectrograph properties
The spectrograph properties together with the telescope properties are
generated with TOAD in a separate project.
All data are stored in the file
qmostetc/data/TOAD_4FS_ETC_interface_data.fits which is a FITS
file with several extensions. The extensions relevant for the
spectrographs are:
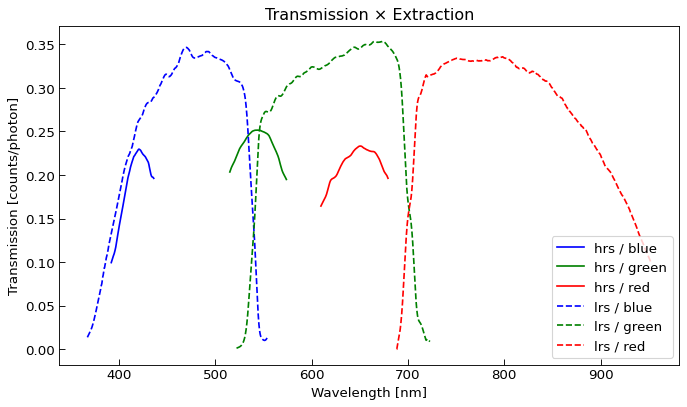
Material
The transmission of the system, including telescope mirrors and spectrograph. Relevant columns:
spectrograph: Spectrograph (
lrsorhrs)spectrograph_arm: Spectrograph arm (one of
blue,green,red)design_wave_interval: Wavelength interval the spectrograph arm is designed for [nm].
wavelength_vector: Wavelength information in [nm].
transmission_vector: Transmission curve [counts/photon]
extraction_vector: Efficiency to extract the spectral bins from the image.
The spectrograph takes the product of transmission and extraction to convert the photon flux into counted electrons.
Design wavelength intervals:
hrs / blue: 392.6 nm … 435.5 nm
hrs / green: 516.0 nm … 573.0 nm
hrs / red: 610.0 nm … 679.0 nm
lrs / blue: 370.0 nm … 554.0 nm
lrs / green: 524.0 nm … 721.0 nm
lrs / red: 691.0 nm … 950.0 nm
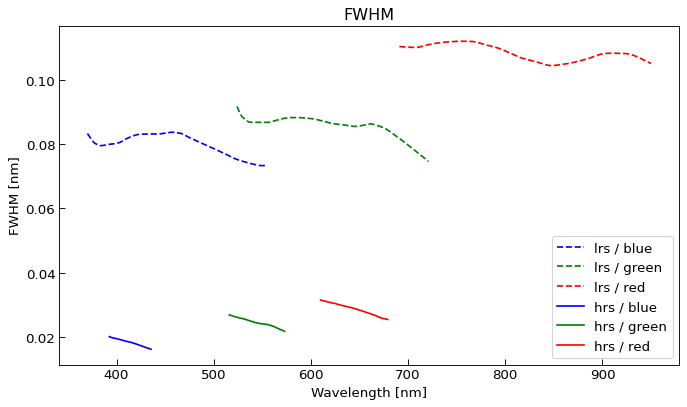
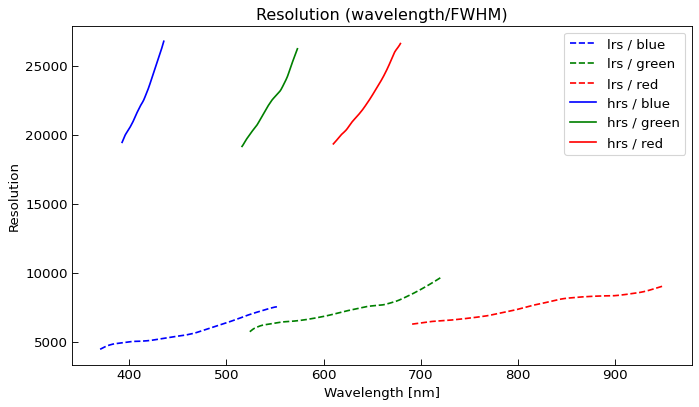
Resolution
Spectrograph resolution curve. Relevant columns:
spectrograph: Spectrograph (
lrsorhrs)spectrograph_arm: Spectrograph arm (one of
blue,green,red)wavelength_vector: Wavelength vector [nm]
fwhm_vector: Full Width Half Maximum vector [nm]
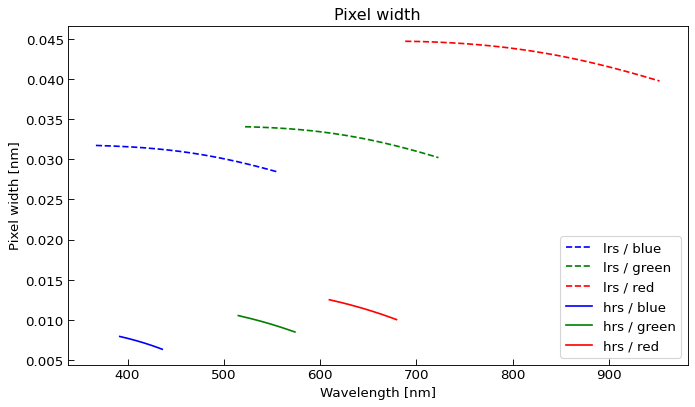
Dispersion
This binary table contains the pixel position on the detector. The columns which are relevant are:
spectrograph: Spectrograph (
lrsorhrs).spectrograph_arm: Spectrograph arm (one of
blue,green,red).wavelength_vector: Wavelength information in [nm].
pixel_width_vector: Spectral width of the pixels [nm].
Detector
CCD properties. The columns relevant for the ETC are:
spectrograph: Spectrograph (
lrsorhrs)spectrograph_arm: Spectrograph arm (one of
blue,green,red)dark_current: The dark current in electrons per pixel per second at the operation temperature of the instrument [count/s].
read_noise: The read noise per pixel, including the amplifier electronics [count].
gain: ADU gain [count/adu]
saturation: Saturation value [adu]
spectrograph
spectrograph_arm
dark_current
read_noise
gain
saturation
hrs
blue
0.000173
2.77646
1.0515
196193
hrs
green
0.000308
2.7193525
1.0623
194814
hrs
red
0.000225
2.31
1.0726
193114
lrs
blue
0.000240
2.3729325
1.0681
199112
lrs
green
0.000113
2.3781925
1.0734
192897
lrs
red
0.000312
2.2213125
1.0633
187379